Following on from the previous post, I needed to setup some basic alerting and dashboards. Opsgenie is being used for paging, but anything that can integrate with SNS will work well. I’ll walk through here how to create alerts in CloudWatch from the metrics, and a basic dashboard using CloudFormation.
I have done a quick bit of maths and if you are using this approach, it will cost about US$6.00 per instance. If you have a lot of instances, you may want to consider what that means for you.
Opsgenie and SNS setup
To add a new SNS Topic that can send messages to Opsgenie is really straight forward. Opsgenie have a great guide.
Once you have your API key, you can create the topics really simply with this CloudFormation:
AWSTemplateFormatVersion: "2010-09-09"
Description: SNS Topic for Opsgenie
Parameters:
  OpsgenieAPIKey:
    Type: String
    Description: Your Opsgenie API Key.
    NoEcho: true
Resources:
  opsgeniesns:
    Type: AWS::SNS::Topic
    Properties:
      TopicName: opsgenie
      Subscription:
        - Endpoint: !Join [ '', [ 'https://api.opsgenie.com/v1/json/cloudwatch?apiKey=', !Ref OpsgenieAPIKey ]]
          Protocol: https
I deployed this within my ControlTower/Stacksets configuration, but you can deploy this into a single account.

CloudWatch Configuration
CWAgent Metrics
In the last post we created a basic configuration. I’ll quickly recap here:
/etc/basic_cloudwatch.json
{
    "agent": {
        "metrics_collection_interval": 300,
        "run_as_user": "root"
    },
    "metrics": {
        "append_dimensions": {
            "InstanceId": "${aws:InstanceId}"
        },
        "metrics_collected": {
            "disk": {

                "drop_device": true,
                "ignore_file_system_types": [
                    "overlay",
                    "sysfs",
                    "devtmpfs",
                    "tmpfs",
                    "devtmpfs",
                    "nfs4"
                ],
                "measurement": [
                    "used_percent",
                    "inodes_free"
                ],
                "resources": [
                    "*"
                ]
            },
            "mem": {
                "measurement": [
                    "mem_used_percent"
                ]
            },
            "swap": {
                "measurement": [
                    "swap_used_percent"
                ]
            }
        }
    }
}
This is installed into the CloudWatch agent with the following command:
/opt/aws/amazon-cloudwatch-agent/bin/amazon-cloudwatch-agent-ctl -a fetch-config -s -m ec2 -c file:/etc/basic-cloudwatch.json
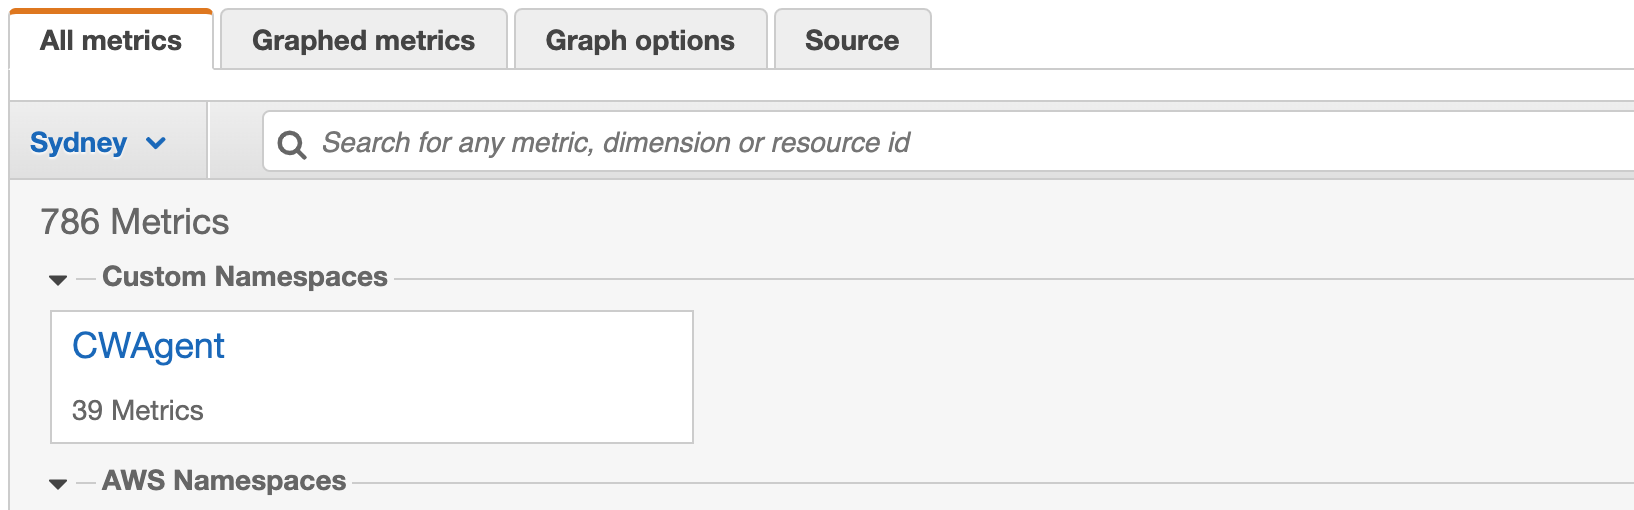
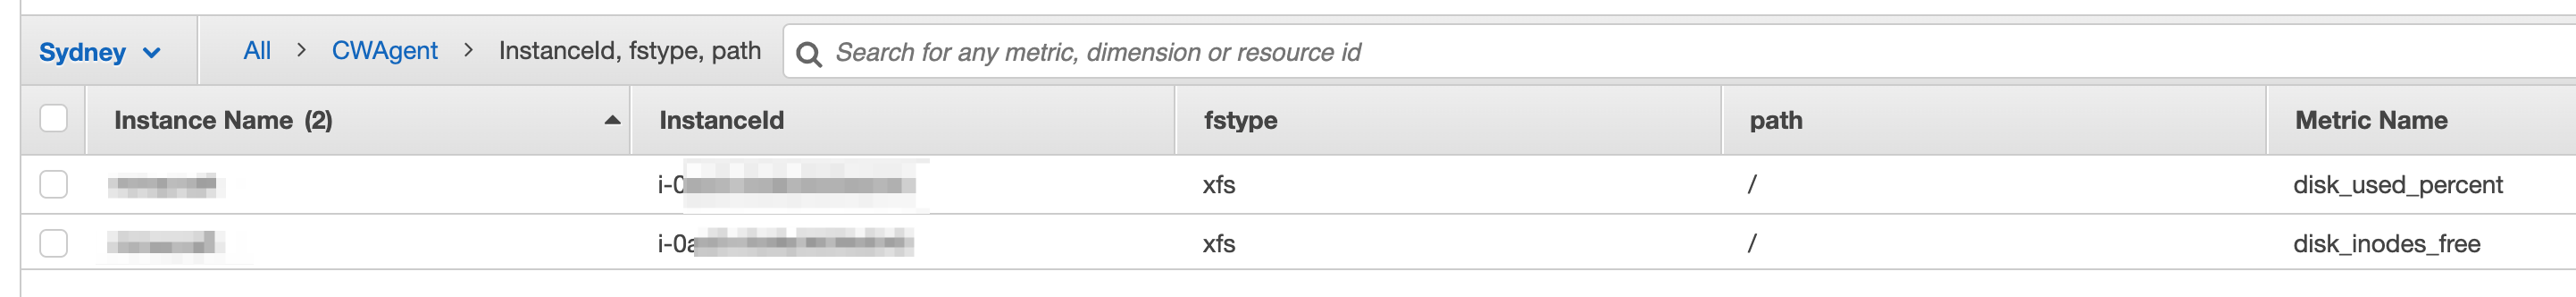
The default namespace is CWAgent, and you can find metrics from the OS in here:
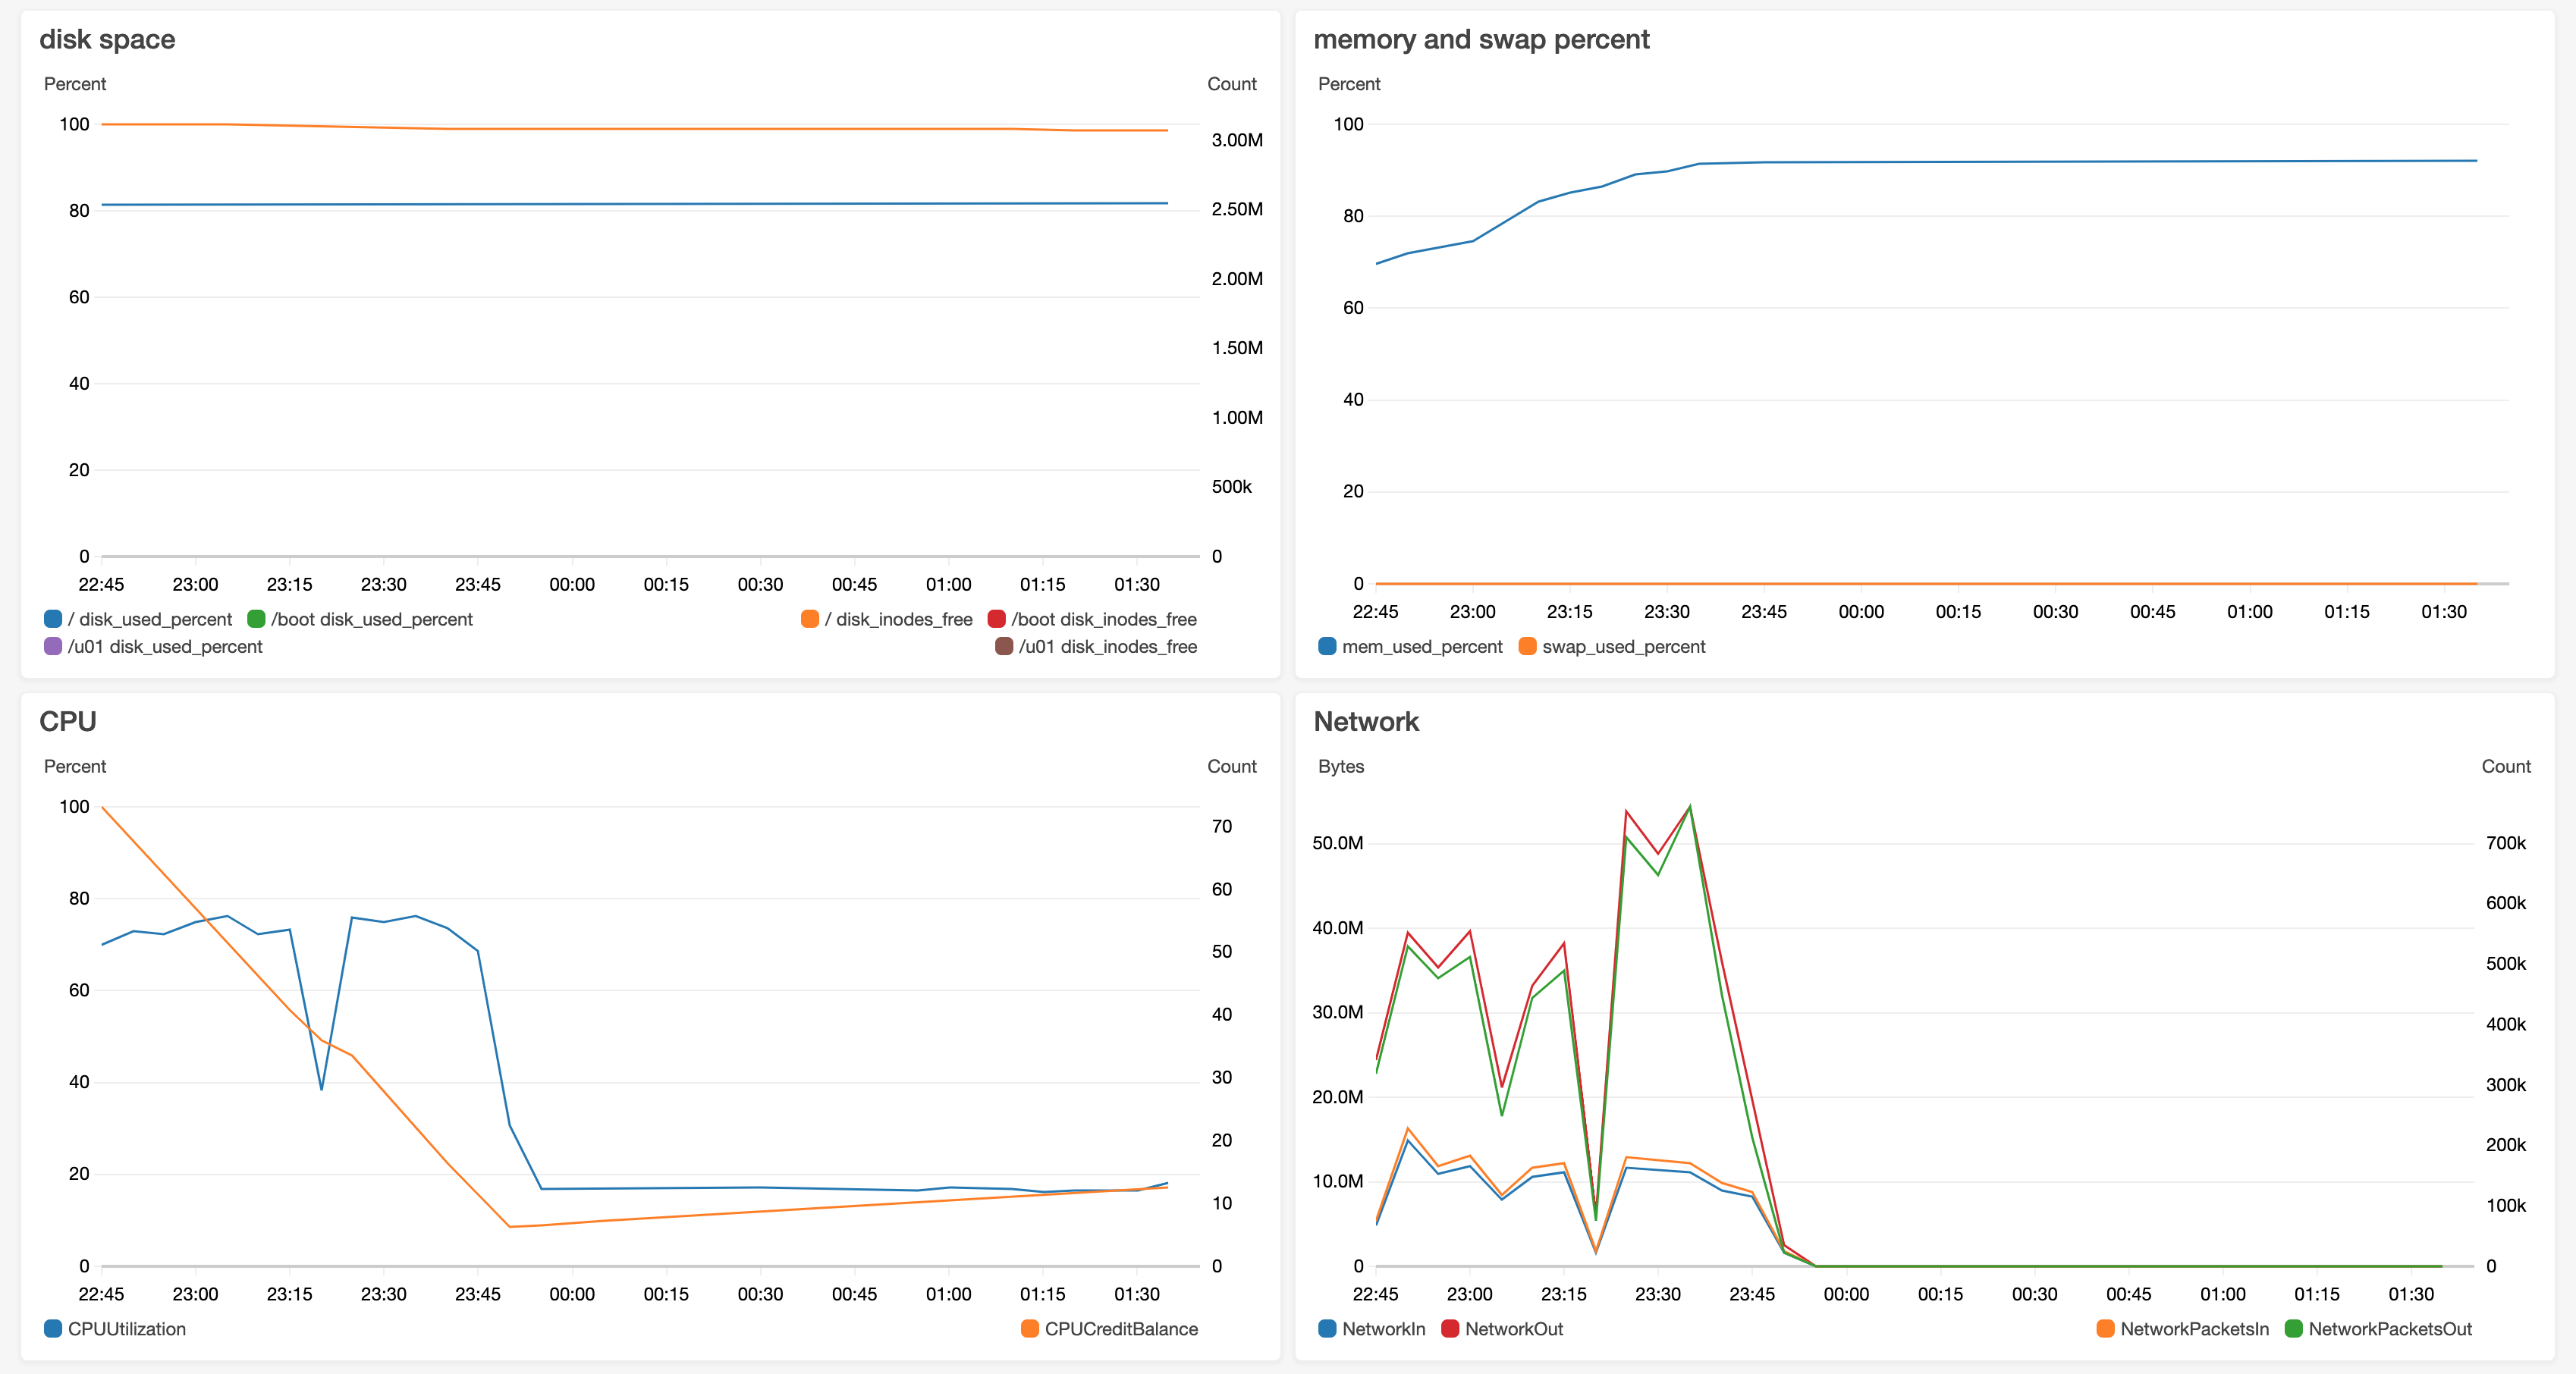
Dashboard
Using these you can create dashboards along with AWS/EC2 metrics:
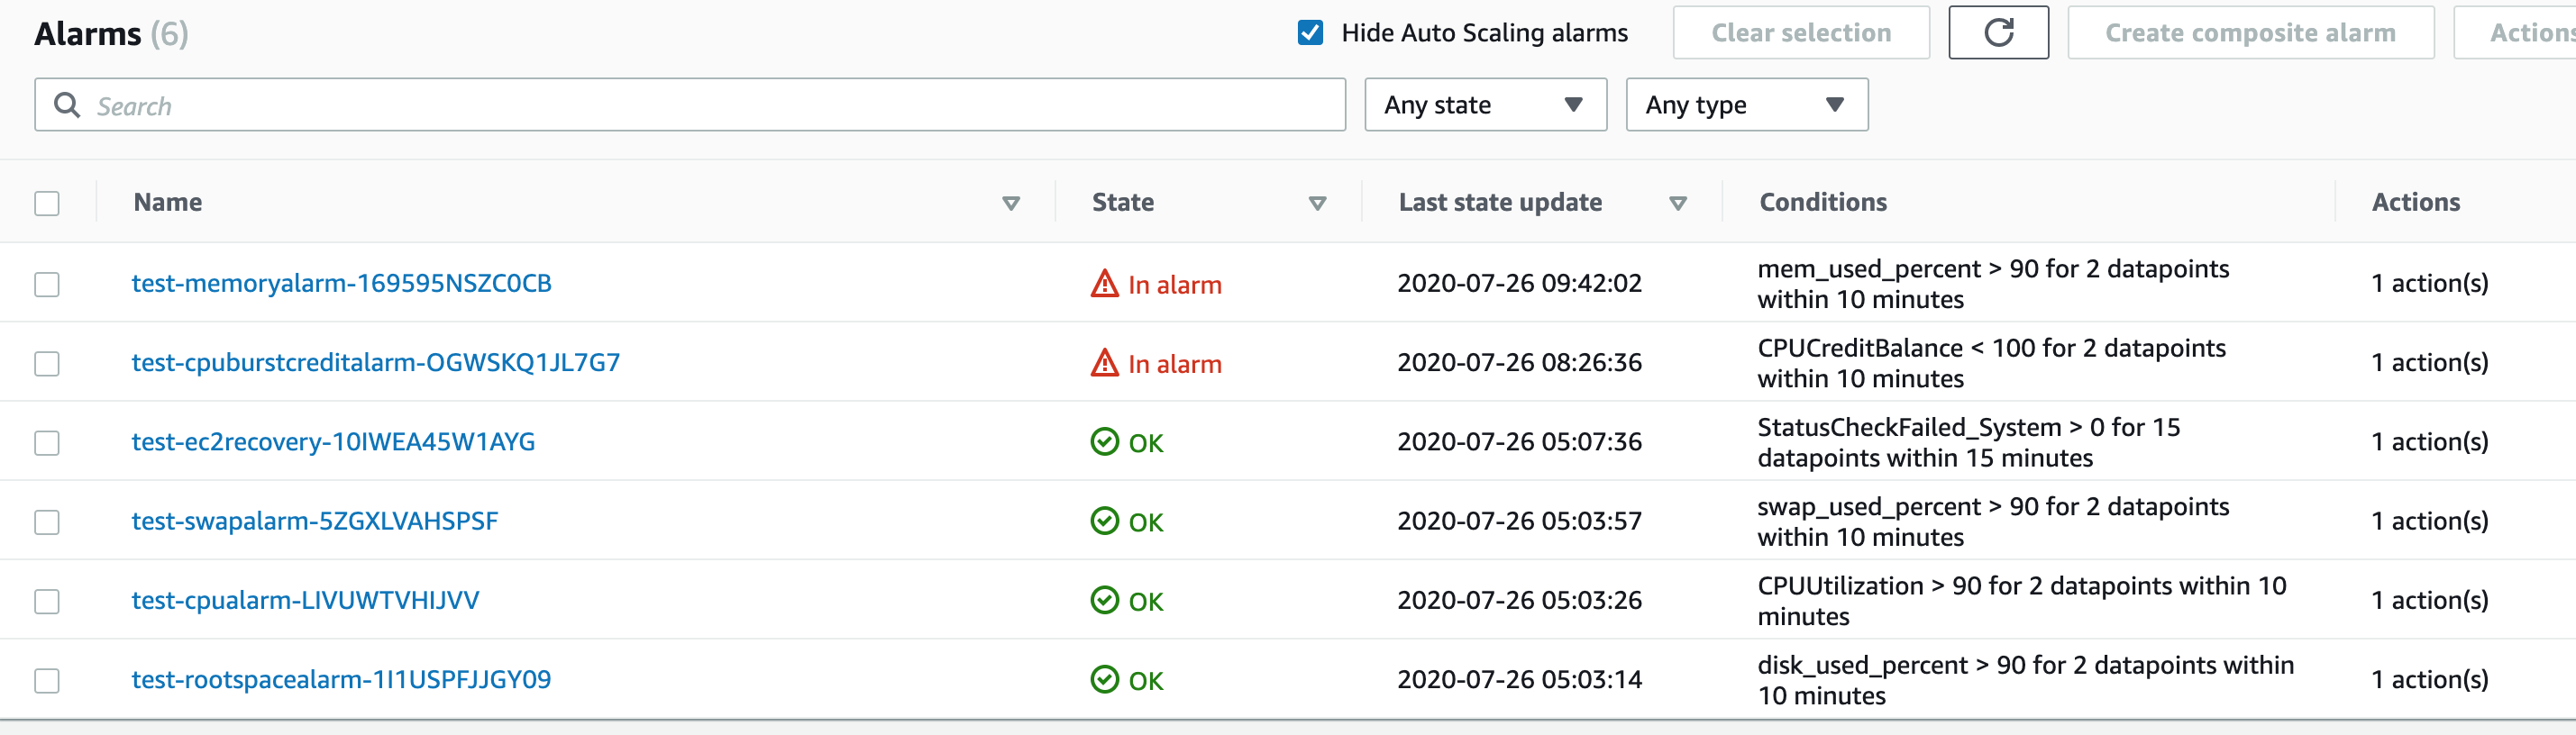
Alarms
And you can also create Alarms:
CloudFormation
Of course because I need to deploy this several times, I’ve created a template:
AWSTemplateFormatVersion: "2010-09-09"
Description: Setup an instance for auto-healing and basic monitoring.
Parameters:
  InstanceId:
    Type: String
    Description: The instance Id you want setup with alarms.
  fstype:
    Type: String
    Description: The filesystem type used.
    AllowedValues:
      - xfs
      - ext4
    Default: xfs
  monitoru01bool:
    Type: String
    Description: Set this to true if you want/have a /u01 partition to monitor.
    AllowedValues:
      - true
      - false
    Default: false
  monitorbootbool:
    Type: String
    Description: Set this to true if you want/have a /boot partition to monitor.
    AllowedValues:
      - true
      - false
    Default: true
  AlarmSNSTopic:
    Type: String
    Description: Name of the SNS Topic to send alarms to (must be in the same region and account)
Conditions:
  monitoru01: !Equals [ !Ref monitoru01bool, true ]
  monitorboot: !Equals [ !Ref monitorbootbool, true ]
Resources:
  ec2recovery:
    Type: AWS::CloudWatch::Alarm
    Properties:
      AlarmDescription: Trigger a recovery when instance status check fails for 15 consecutive minutes.
      Namespace: AWS/EC2
      MetricName: StatusCheckFailed_System
      Statistic: Minimum
      Period: 60
      EvaluationPeriods: 15
      ComparisonOperator: GreaterThanThreshold
      Threshold: 0
      AlarmActions: [ !Sub "arn:aws:automate:${AWS::Region}:ec2:recover" ]
      Dimensions:
      - Name: InstanceId
        Value: !Ref InstanceId
  rootspacealarm:
    Type: AWS::CloudWatch::Alarm
    Properties:
      ComparisonOperator: GreaterThanThreshold
      MetricName: disk_used_percent
      Namespace: CWAgent
      Statistic: Average
      Period: 300
      EvaluationPeriods: 2
      Threshold: 90
      Dimensions:
        - Name: InstanceId
          Value: !Ref InstanceId
        - Name: path
          Value: /
        - Name: fstype
          Value: !Ref fstype
      AlarmActions: [ !Sub "arn:aws:sns:${AWS::Region}:${AWS::AccountId}:${AlarmSNSTopic}"]
      OKActions: [ !Sub "arn:aws:sns:${AWS::Region}:${AWS::AccountId}:${AlarmSNSTopic}"]
  bootspacealarm:
    Type: AWS::CloudWatch::Alarm
    Condition: monitorboot
    Properties:
      ComparisonOperator: GreaterThanThreshold
      MetricName: disk_used_percent
      Namespace: CWAgent
      Statistic: Average
      Period: 300
      EvaluationPeriods: 2
      Threshold: 90
      Dimensions:
        - Name: InstanceId
          Value: !Ref InstanceId
        - Name: path
          Value: /boot
        - Name: fstype
          Value: !Ref fstype
      AlarmActions: [ !Sub "arn:aws:sns:${AWS::Region}:${AWS::AccountId}:${AlarmSNSTopic}"]
      OKActions: [ !Sub "arn:aws:sns:${AWS::Region}:${AWS::AccountId}:${AlarmSNSTopic}"]
  u01spacealarm:
    Type: AWS::CloudWatch::Alarm
    Condition: monitoru01
    Properties:
      ComparisonOperator: GreaterThanThreshold
      MetricName: disk_used_percent
      Namespace: CWAgent
      Statistic: Average
      Period: 300
      EvaluationPeriods: 2
      Threshold: 90
      Dimensions:
        - Name: InstanceId
          Value: !Ref InstanceId
        - Name: path
          Value: /u01
        - Name: fstype
          Value: !Ref fstype
      AlarmActions: [ !Sub "arn:aws:sns:${AWS::Region}:${AWS::AccountId}:${AlarmSNSTopic}"]
      OKActions: [ !Sub "arn:aws:sns:${AWS::Region}:${AWS::AccountId}:${AlarmSNSTopic}"]
  memoryalarm:
    Type: AWS::CloudWatch::Alarm
    Properties:
      ComparisonOperator: GreaterThanThreshold
      MetricName: mem_used_percent
      Namespace: CWAgent
      Statistic: Average
      Period: 300
      EvaluationPeriods: 2
      Threshold: 90
      Dimensions:
        - Name: InstanceId
          Value: !Ref InstanceId
      AlarmActions: [ !Sub "arn:aws:sns:${AWS::Region}:${AWS::AccountId}:${AlarmSNSTopic}"]
      OKActions: [ !Sub "arn:aws:sns:${AWS::Region}:${AWS::AccountId}:${AlarmSNSTopic}"]
  swapalarm:
    Type: AWS::CloudWatch::Alarm
    Properties:
      ComparisonOperator: GreaterThanThreshold
      MetricName: swap_used_percent
      Namespace: CWAgent
      Statistic: Average
      Period: 300
      EvaluationPeriods: 2
      Threshold: 90
      Dimensions:
        - Name: InstanceId
          Value: !Ref InstanceId
      AlarmActions: [ !Sub "arn:aws:sns:${AWS::Region}:${AWS::AccountId}:${AlarmSNSTopic}"]
      OKActions: [ !Sub "arn:aws:sns:${AWS::Region}:${AWS::AccountId}:${AlarmSNSTopic}"]
  cpualarm:
    Type: AWS::CloudWatch::Alarm
    Properties:
      ComparisonOperator: GreaterThanThreshold
      MetricName: CPUUtilization
      Namespace: AWS/EC2
      Statistic: Average
      Period: 300
      EvaluationPeriods: 2
      Threshold: 90
      Dimensions:
        - Name: InstanceId
          Value: !Ref InstanceId
      AlarmActions: [ !Sub "arn:aws:sns:${AWS::Region}:${AWS::AccountId}:${AlarmSNSTopic}"]
      OKActions: [ !Sub "arn:aws:sns:${AWS::Region}:${AWS::AccountId}:${AlarmSNSTopic}"]
  cpuburstcreditalarm:
    Type: AWS::CloudWatch::Alarm
    Properties:
      ComparisonOperator: LessThanThreshold
      MetricName: CPUCreditBalance
      Namespace: AWS/EC2
      Statistic: Average
      Period: 300
      EvaluationPeriods: 2
      Threshold: 100
      Dimensions:
        - Name: InstanceId
          Value: !Ref InstanceId
      AlarmActions: [ !Sub "arn:aws:sns:${AWS::Region}:${AWS::AccountId}:${AlarmSNSTopic}"]
      OKActions: [ !Sub "arn:aws:sns:${AWS::Region}:${AWS::AccountId}:${AlarmSNSTopic}"]
  dashboard:
    Type: AWS::CloudWatch::Dashboard
    Properties:
      DashboardBody: !Sub '{
    "widgets": [
        {
            "type": "metric",
            "x": 0,
            "y": 0,
            "width": 12,
            "height": 9,
            "properties": {
                "metrics": [
                    [ "CWAgent", "disk_used_percent", "path", "/", "InstanceId", "${InstanceId}", "fstype", "xfs", { "label": "/ disk_used_percent" }  ],
                    [ ".", "disk_inodes_free", ".", ".", ".", ".", ".", ".", { "yAxis": "right", "label": "/ disk_inodes_free" } ],
                    [ "CWAgent", "disk_used_percent", "path", "/boot", "InstanceId", "${InstanceId}", "fstype", "xfs", { "label": "/boot disk_used_percent" } ],
                    [ ".", "disk_inodes_free", ".", ".", ".", ".", ".", ".", { "yAxis": "right", "label": "/boot disk_inodes_free" } ],
                    [ "CWAgent", "disk_used_percent", "path", "/u01", "InstanceId", "${InstanceId}", "fstype", "xfs", { "label": "/u01 disk_used_percent" } ],
                    [ ".", "disk_inodes_free", ".", ".", ".", ".", ".", ".", { "yAxis": "right", "label": "/u01 disk_inodes_free" } ]
                ],
                "view": "timeSeries",
                "stacked": false,
                "region": "${AWS::Region}",
                "title": "disk space",
                "stat": "Average",
                "period": 300,
                "yAxis": {
                    "left": {
                        "min": 0,
                        "max": 100
                    },
                    "right": {
                        "min": 0
                    }
                }
            }
        },
        {
            "type": "metric",
            "x": 12,
            "y": 0,
            "width": 12,
            "height": 9,
            "properties": {
                "metrics": [
                    [ "CWAgent", "mem_used_percent", "InstanceId", "${InstanceId}" ],
                    [ ".", "swap_used_percent", ".", "." ]
                ],
                "view": "timeSeries",
                "stacked": false,
                "region": "${AWS::Region}",
                "title": "memory and swap percent",
                "stat": "Average",
                "period": 300,
                "yAxis": {
                    "left": {
                        "min": 0,
                        "max": 100
                    },
                    "right": {
                        "min": 0,
                        "showUnits": false
                    }
                }
            }
        },
        {
            "type": "metric",
            "x": 0,
            "y": 9,
            "width": 12,
            "height": 9,
            "properties": {
                "metrics": [
                    [ "AWS/EC2", "CPUUtilization", "InstanceId", "${InstanceId}" ],
                    [ ".", "CPUCreditBalance", ".", ".", { "yAxis": "right" } ]
                ],
                "view": "timeSeries",
                "stacked": false,
                "region": "${AWS::Region}",
                "title": "CPU",
                "stat": "Average",
                "period": 300,
                "yAxis": {
                    "left": {
                        "min": 0,
                        "max": 100
                    },
                    "right": {
                        "min": 0,
                        "showUnits": true
                    }
                }
            }
        },
        {
            "type": "metric",
            "x": 12,
            "y": 9,
            "width": 12,
            "height": 9,
            "properties": {
                "metrics": [
                    [ "AWS/EC2", "NetworkIn", "InstanceId", "${InstanceId}" ],
                    [ ".", "NetworkPacketsIn", ".", ".", { "yAxis": "right" } ],
                    [ ".", "NetworkPacketsOut", ".", ".", { "yAxis": "right" } ],
                    [ ".", "NetworkOut", ".", "." ]
                ],
                "view": "timeSeries",
                "stacked": false,
                "region": "${AWS::Region}",
                "title": "Network",
                "stat": "Average",
                "period": 300,
                "yAxis": {
                    "right": {
                        "showUnits": true,
                        "min": 0
                    },
                    "left": {
                        "min": 0
                    }
                }
            }
        }
    ]
  }'
      DashboardName: !Ref InstanceId
This has a few specifics for the environment I’m dealing with, but can easily be modifid to fit your environment.
You can deploy this easily from here:
Summary
As you can see it is really easy to get some basic monitoring setup to alarm you via Opsgenie and also to have a simple dashboard to provide a view of your EC2 system performance.